Data in Modern Manufacturing
In modern manufacturing, data is generated every second. It flows from floor equipment, quality applications, and complex ERP modules, and often isolated “personal” Excel files. While these data points are vital for delivering reliable products on time, their fragmentation turns most production sites into a complex maze of disconnected systems.
This lack of integration makes operational visibility a significant challenge. When a performance dip occurs, diagnosing the root cause often requires hours of manual cross-departmental analysis. While teams scramble to find answers, the consequences are real and immediate: yield drops, backorders pile up, and machines continue to churn out defective products.
In manufacturing, time is literally money. A defective process will continue to drain profitability until it is flagged, understood, and corrected. Depending on a site’s digital maturity, this response time can range from minutes to days, but every second of delay is a second of lost revenue.
To stay competitive, facilities must act with total agility. Whether it’s detecting equipment failure, visualizing defect patterns, or tracking lagging product families, speed is the ultimate currency. Real-time operational dashboards serve as the plant’s heartbeat, providing the minute-by-minute visibility required to drive the right actions at the right time.
The High Cost of “Delayed Visibility”
When a site lacks real-time visibility, understanding performance becomes a forensic exercise rather than a proactive one. Figuring out why a line slowed down requires manual analysis from multiple departments. By the time the meeting ends and the problem is identified, the damage is already done:
- Yield Loss: Defective parts continue to be produced until the root cause is flagged.
- Backorder Risk: Missed delivery rates creating a negative impact in customer service.
- Wasted Labor: High-value engineers spend hours “massaging data” in spreadsheets instead of fixing machines.
Every second a machine operates under-capacity or produces defects, money flows out the door. To protect margins, a site must act at the speed of the data it generates.
What’s a Real-Time operational dashboard?
An operational dashboard is more than a visual interface with graphs and charts; it is a real-time feedback loop. Much like a car’s dashboard allows a driver to adjust speed or check engine heat instantly, a manufacturing dashboard allows a plant manager to see the “health” of the floor at a glance.
By unifying disparate data sources, from the ERP to the manufacturing system, these dashboards empower operators, supervisors, and engineers to detect issues in seconds. This ensures that production stays aligned with the plan, turning a reactive environment into a data-driven powerhouse.
Key Metrics to Track
To drive instant, data-backed actions, your dashboard should focus on high-impact KPIs:
- Output: Real-time production volume vs. targets.
- Quality & Yield: Identifying deviations from the standard immediately.
- OEE (Overall Equipment Effectiveness): A comprehensive view of machine health.
- Status & Downtime: Categorizing why a machine isn’t running to prevent recurrence.
Every metric critical to your process can be tracked, the most important is to have a clear visibility of your performance, so you can drive instant data-backed actions to ensure your process is align to your standard.
At Pathworks, we can help you understand the metrics that drive your performance and create custom dashboards to specifically track those metrics.
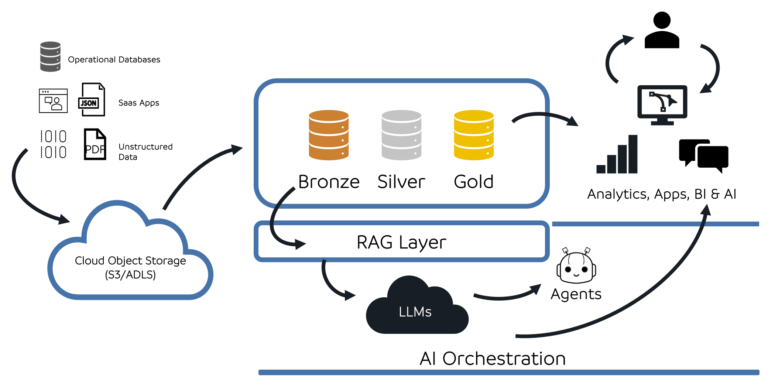
The Future: AI-Enabled Manufacturing Analytics
We are entering the era of the AI-Enabled Dashboard, which moves from “what happened” to “what should we do?”
1. Interactive Data Discovery
Instead of clicking through filters, users can directly interact with an AI agent. An engineer can ask, “Why did the reject rate on Line 2 spike during the night shift?” The AI can instantly correlate temperature fluctuations with material batches to provide an answer in seconds.
2. Predictive Decision Support
AI models can analyze historical trends to flag deviations before they result in failure. If a motor’s vibration pattern changes slightly, the dashboard doesn’t just show a red light; it alerts maintenance that a failure is likely within the next 48 hours.
3. Automated Governance
AI can drive actions by automatically triggering a “Stop Work” order or sending a high-priority alert to a supervisor if the yield drops below a specific threshold for more than five minutes.
The Pathworks 8-Step Implementation Process
Building a dashboard is easy; building a tool that people actually use is difficult. We follow a user-centric development process designed for high adoption:
1. Evaluate Process Opportunities
We start by auditing how your team currently makes decisions. Who is responsible for what? How often is the floor monitored? We identify the “action gaps” where data is currently missing.
2. Identify “North Star” Metrics
We filter out the noise. We help you identify the 3–5 metrics that truly drive your profitability, ensuring the dashboard remains focused and actionable.
3. Build a Scalable Data Infrastructure
Data is the core of any AI agent or report. We help bridge the gap between IT (Information Technology) and OT (Operational Technology), ensuring your data is clean, secure, and delivered in real-time.
4. User-Centric (UX) Design
We put operators, supervisors, and engineers at the center. A dashboard on a 60-inch floor monitor needs a different design than one on a supervisor’s tablet. We design for “at-a-glance” comprehension.
5. Agile Development (The MVD Approach)
We don’t believe in six-month wait times. We start with a Minimum Viable Dashboard (MVD), focusing on a single line or metric to prove value quickly and iterate based on real user feedback.
6. Embed in Daily Routines
A tool only adds value if it’s used. We help integrate these dashboards into your shift handovers, “Gemba” walks, and production huddles so they become part of the site’s DNA.
7. Create a Governance Structure
We define the “so what?” When the dashboard turns red, who is notified? What is the escalation path? This ensures data leads to action, not just observation.
8. Continuous Improvement (Kaizen)
Manufacturing is dynamic. As you add new machines or product families, your data tools must evolve. We provide the support to ensure your dashboards remain an accurate reflection of your reality.
Ready to Digitize Your Floor?
The difference between a profitable shift and a loss-making one is often the speed of information. At Pathworks, we specialize in transforming raw manufacturing data into custom, AI-powered dashboards that drive results.
Stop managing by looking in the rearview mirror. Contact Pathworks today for a consultation on how to build your site’s digital heartbeat.