At its core, managing performance is the heartbeat of a successful business. Having a clear and accurate pulse on how your organization is performing isn’t just a nice to have; it is the foundation for making sound decisions every single day.
However, we know that in practice, this is easier said than done. Navigating the intricate web of modern processes, systems, and shifting variables can feel like a monumental task. Generally, the larger the organization, the greater the complexity but also the greater the opportunity for transformation. Think of it this way: if keeping track of personal weekly expenses feels like a puzzle with so many digital payment methods today, imagine the scale of that challenge across an entire enterprise. It is a hurdle we all face, but one that holds the key to unlocking true growth.
Understanding What to Measure
The first step in developing a robust performance management system is identifying the core business goals your organization is striving to achieve. Usually defined by leadership and shared from the top down, these goals serve as your North Star. While they vary by industry, the underlying objective remains the same: driving profitability by either growing revenue or optimizing costs.
Once these goals are clear, we can define the metrics. These are highly specific to your industry, your level within the company, and your day-to-day scope. For example, a VP needs visibility across multiple functional areas, requiring high-level data that is heavily focused on financial health. Meanwhile, a manager on the front lines needs granular, operational details about what is happening every day, or even every hour. Defining this scope and selecting these metrics is the essential first step in identifying the data that is truly vital to managing your company’s operations.
A Unified Source of Truth: Where the Data Comes From
The next step is mapping the systems and processes that provide the data needed for decision-making. This information often lives across various platforms, ERPs for resource planning, CRMs for customer relationships, MES for manufacturing, or even directly within the machines on the shop floor. In many cases, these systems must be interconnected to paint an accurate picture of the truth.
This stage is vital because it forms the bedrock of all future analytics. By consolidating these streams, you are not just managing current performance; you are unlocking the ability to uncover hidden opportunities through advanced analytics, machine learning, and AI.
For organizations that still track progress manually, the transition to modern software is a significant milestone. It is more than just a technical upgrade; it is an investment that empowers your team with new capabilities and provides the clarity needed to truly elevate performance.
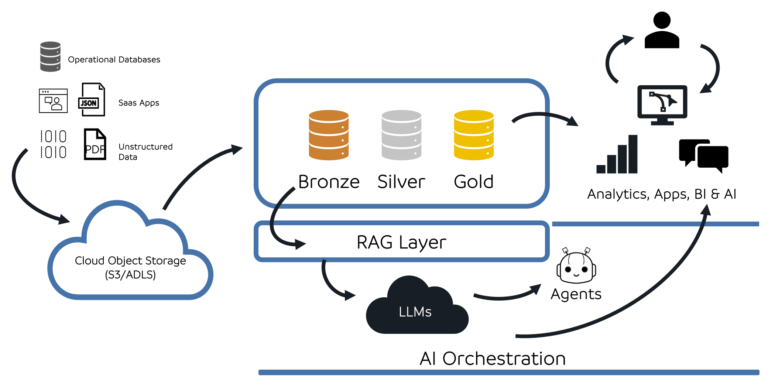
The Data Layer: Foundation of Intelligence
Once there is a clear understanding of your systems and processes, the next step is to ‘connect’ them. This involves consolidating your information into a centralized data lake, warehouse, or lake house. While the specific tools you choose will depend on your unique business needs, the goal remains the same: creating a single, accessible home for your organization’s intelligence.
In our experience, we have found that it is almost always better to have more data than less. You may find certain data tables that do not have an immediate use for your current project, but that does not mean they won’t be the key to a breakthrough tomorrow. An organization with a truly agile mindset is constantly evolving and developing new tools to sharpen its processes. By capturing a broad spectrum of information now, you are essentially pre-funding your future innovations.
The bottom line is simple: by creating a robust, centralized data layer with as much information as possible, you aren’t just storing numbers—you are building a foundation that allows your company to pivot quickly and act on insights that haven’t even been discovered yet.
You can learn more about Pathworks approach to designing a data layer in the article **INSERT ARTICLE**.
The Visualization Layer: Turning Information into Action
The final piece of the puzzle is where the hard work of data consolidation becomes visible: the visualization layer. This is where those complex data sets are transformed into intuitive, real-time dashboards that your team can actually use. At this stage, powerful business intelligence tools such as Power BI and Tableau come into play, serving as the window into your operations and making sense of the vast amounts of information you have collected.
Having a robust data layer is essential, but it only delivers value when it is presented in a way that tells a coherent story. For a shop floor manager, this might look like a simple red or green indicator of hourly targets. For an executive, it might be a high level trend analysis of operational efficiency across multiple sites. These tools allow you to tailor the view to the specific needs of the user, ensuring the right people see the right data at the right time.
The goal here is clarity. When everyone in the organization, from the front lines to the C-suite, has a clear view of the scorecard, the culture shifts from reactive to proactive. You no longer have to wait for end of month reports to realize there was a problem; instead, you can see the pulse of the business in real time and make the necessary adjustments to stay on track. This transparency is what ultimately bridges the gap between having a strategy and achieving your goals.
You can learn more about designing real-time dashboards in our article: https://getpathworks.com/real-time-dashboards-as-the-heartbeat-for-manufacturing-operations/
AI Enabled Analytics
Having your data consolidated and visible already provides the foundation for a successful performance management strategy. However, while traditional dashboards are excellent at displaying what is happening in the moment, embedding AI into your strategy allows you to look ahead. By connecting your data layer to Generative AI tools and applying machine learning algorithms, your organization can move beyond simple monitoring and begin to engage in predictive and prescriptive management.
In a practical sense, this means your systems can start to identify patterns that are often invisible to the human eye. Instead of simply reacting to a machine failure after it occurs, AI can analyze subtle vibration and temperature trends to alert your team days before a breakdown happens. In the front office, these tools can forecast demand with incredible accuracy, allowing you to optimize inventory and staffing levels well in advance of market shifts.
Taking this a step further, you can explore the potential of Agentic AI. These are systems designed to not only analyze data but to take human like actions within the decision making loop. Imagine an active intelligence that can automatically adjust supply chain orders or reschedule maintenance based on real time insights, serving as a tireless assistant to your management team.
This stage of the journey is where true digital maturity is realized. AI enabled analytics act as a strategic partner, filtering through the noise to provide your team with the most critical insights. It empowers your people to spend less time digging through spreadsheets and more time acting on the strategic opportunities that drive the business forward.
Looking Ahead
Managing performance in the modern era is about much more than just keeping track of numbers; it is about creating a culture of clarity, agility, and foresight. By establishing a North Star through clear metrics, consolidating your information into a unified data layer, and leveraging the power of visualization and AI, you transform your organization from a reactive entity into a proactive leader. This journey toward digital maturity does not just improve your bottom line; it empowers your most valuable asset—your people—by giving them the tools and the time they need to focus on true innovation.
While the road to a fully integrated, AI enabled operation can feel complex, you do not have to navigate it alone. At Pathworks, we specialize in helping businesses bridge the gap between their current data challenges and their future strategic goals. Whether you are just beginning to define your metrics or you are ready to implement agentic AI into your decision making loop, we are here to provide the expertise and the roadmap you need to succeed.
Is your organization ready to turn its operational data into a strategic heartbeat? Reach out to us at Pathworks today, and let’s begin building your roadmap for growth together.