If we imagine an organization as a human body, data is the lifeblood that keeps every system functioning. In a modern enterprise, operations are sustained by a vast ecosystem of platforms, from ERPs and CRMs to billing, accounting, and specialized Point of Sale (POS) systems. If there is a niche business need, there is almost certainly a specialized system designed to meet it.
However, keeping a pulse on what is truly happening across these systems is a significant challenge. These vital data sources are often siloed, operating in isolation from one another. Even when they are linked, communication latency can create a fragmented view of reality. To truly harness the value of a Business Intelligence strategy, these systems must be more than just connected; the data must be expertly integrated and transformed. Only then can it be leveraged by business users to drive the informed, high-stakes decisions that move a company forward.
Framing the Foundation: The Pathworks Framework
So, how do you build an analytics architecture that doesn’t just store data, but actively improves the business model? At Pathworks, we utilize a four-step framework that aligns with the ELT (Extract, Load, Transform) process while keeping the business outcome at the center:
- Processes and Systems
- Data Layer
- Insights and Visualization
- Actions and Governance
Step 1: Processes and Systems
Before a single line of code is written, we must understand the “why.” The first step is to evaluate how each system supports the underlying business process and identify the core value it provides.
Interestingly, we often find that organizations are “under-utilizing” their current tech stack. It’s common to encounter customers who are already paying for functionalities that could solve their most pressing problems if only they were properly configured. During this phase, we perform a gap analysis to see if a process can be optimized using existing system features before moving to the data stage.
The key deliverable here is a roadmap for the future. We aim to gain a crystal-clear understanding of how a process can be elevated through advanced analytics and AI. Essentially, this step is about discovering exactly where the data’s value lies so we can build with purpose.
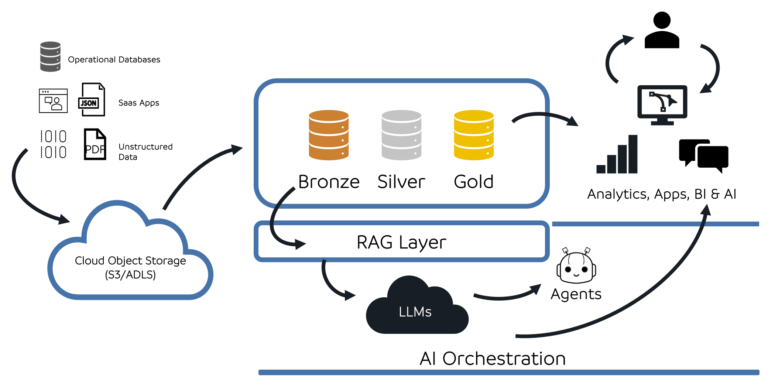
Step 2: Data Layer
Once the business processes are mapped, we move into the Data Layer. This is where the strategy begins to take physical shape. In this phase, you connect your various source systems into a unified repository—frequently referred to in modern architecture as a Data Lake or a Lakehouse.
The mechanics are straightforward but powerful: you ingest data from all your disparate systems into a centralized “big database.” At this initial stage, the data is stored in its original format—exactly as it exists in the source system. This is known as Raw Data.
Why start with Raw Data?
By landing the data in its native state first, you ensure that no information is lost in translation. It serves as a permanent “point of truth” that you can return to if your business logic changes later.
Another benefit of starting with raw data is that you have all your available context from the source to train AI models, enabling all sorts of possibilitites with agentic AI.
Refining the Gold – Moving Beyond Raw Data
Once the data is safely housed in your Data Lake, the real work begins. We sift through the noise to identify the specific tables and fields that hold genuine business value. This is where we move from “quantity” to “quality,” transitioning from a massive collection of raw files to a structured environment.
In this step, we focus on:
- Centralization: Creating a single source of truth that bridges the gaps between all your different systems.
- Democratization: Having data in a centralized repository enables digital users to build tools and applications to improve various processes. When data remains trapped in its core system, only the users of that specific platform can leverage it. Moving it to a shared repository opens the door to new applications, dashboards, and AI solutions across the company.
- Preparation: Transforming raw data into tables that are “friendly” for analytics and AI, ensuring they are optimized to generate meaningful insights.
Essentially, the Data Layer is the engine room of your BI architecture. It’s where the “blood” from our earlier analogy is collected and prepared for circulation throughout the rest of the organization.
Step 3: Insights and Visualization
Once the Data Layer is established, the theoretical value we defined in step one finally becomes a reality. The information is now primed and ready; it’s time to put it to work.
The primary objective of this stage is to translate that stored data into clear, accessible insights. While data is the fuel, visualization is the steering wheel. One of the most effective ways to present this is through dashboards, which synthesize complex datasets into an “actionable” format.
I cannot emphasize the word ACTIONABLE enough. The ultimate goal of any analytical strategy is to drive change. If a chart doesn’t inspire a decision or an action, it’s just a pretty picture. To ensure the right people get the right information at the right time, we utilize several delivery methods:
- Dashboards: The classic visual interface using graphs and tables to communicate high-level performance and trends at a glance.
- AI-Enabled Dashboards: Traditional dashboards augmented with Natural Language Processing (NLP) capabilities, allowing users to ask questions like, “Why did sales dip in October?” and receive immediate visual answers.
- AI Agents: A more conversational approach where users can “talk” to their data. These agents can generate custom graphs, summaries, or even images based on specific user prompts.
- Alerts: Proactive communication, such as automated Slack messages or emails, that triggers when a specific KPI hits a threshold (e.g., an “Inventory Low” alert).
- Reports: Structured, pre-defined tables designed for depth and consistency—ideal for financial audits or operational reviews that require the same view every time they are run.
By diversifying how we present insights, we ensure that the data meets the user where they are, whether they need a 30,000-foot view or a deep dive into the granular details.
Learn more about Pathworks data layer approach on our article: https://getpathworks.com/modern-data-layer-enabling-your-ai-and-analytics-a-strategic-guide/
Step 4: Actions and Governance
The final success of an analytics architecture is measured by the actions it inspires. But how do we ensure those actions are driven systematically, rather than just during the “honeymoon phase” when the tools are new?
The answer lies in Governance. At Pathworks, we utilize a specific framework to ensure that analytics are leveraged consistently:
Clear Accountability and Metric Ownership
Data without an owner is just noise. It must be crystal clear who is responsible for optimizing which business metric. For example:
- The Floor Supervisor owns hourly output.
- The Maintenance Manager owns machine efficiency.
- The Plant Manager owns the site income dashboard.
When someone “owns” a report, they own the outcomes it represents.
Adoption from the Ground Up
We believe in implementing an analytics strategy starting with the most operational decision makers. These “front line” users make hour by hour decisions that have a direct, cumulative impact on the business. Because they are the ones managing the data, they own the “ground truth.”
Leadership Committed to Technology
Adoption starts at the bottom, but it is fueled from the top. When leadership is vocally committed to improving processes through technology, organizational change happens faster. Leadership does not just look at charts; they use them to drive high level strategy.
Structured Meetings to Track Metrics
Data only lives if it is talked about. Establishing a disciplined forum—be it a daily stand up, a weekly review, or a monthly steering committee—is essential. Most organizations already have performance systems in place; the key is to ground these meetings in your analytics tools.
Improvement Focused on User Experience
At its heart, any Analytics and AI strategy must be built with empathy. If a system is difficult to access or hard to read, it will be ignored. Information must be readily available and intuitive. Everyone in the organization should be able to glance at a screen and understand immediately if things are going well, if they are not, and exactly which “levers” they can pull to improve the situation.
From Architecture to Action
Building a modern analytics architecture is about more than just choosing the right database or the flashiest visualization tool. It is about creating a healthy, integrated system where data flows seamlessly from the “limbs” of the organization back to the “brain” for decision making.
By following this four step framework, you transform data from a stagnant resource into a dynamic asset. When you align your systems with your processes, centralize your data layer, visualize actionable insights, and enforce a culture of governance, you are not just building a report; you are building a competitive advantage. The anatomy of insight is complex, but when every part works in harmony, the results are transformative.
To learn more about performance management visit the article: https://getpathworks.com/performance-management-from-data-to-decisions/
Ready to Modernize Your Data Strategy?
At Pathworks, we specialize in helping organizations bridge the gap between raw data and tangible business results. Whether you are struggling with data silos, looking to implement Agentic AI, or needing to build a culture of accountability around your KPIs, we are here to help.
Let’s build your blueprint for success together.